Promotional Efficacy
SYCARDA tracks SKU and sales data in a manner that it allows business owners and managers to measure promotional efficacy and allows them to learn for past promotions and plan for the future more effectively.


How will you benefit from SYCARDA's Payment Trends module?


Business Management


Revenue Management


Outlet Management


Sales & Marketing
Related key reports


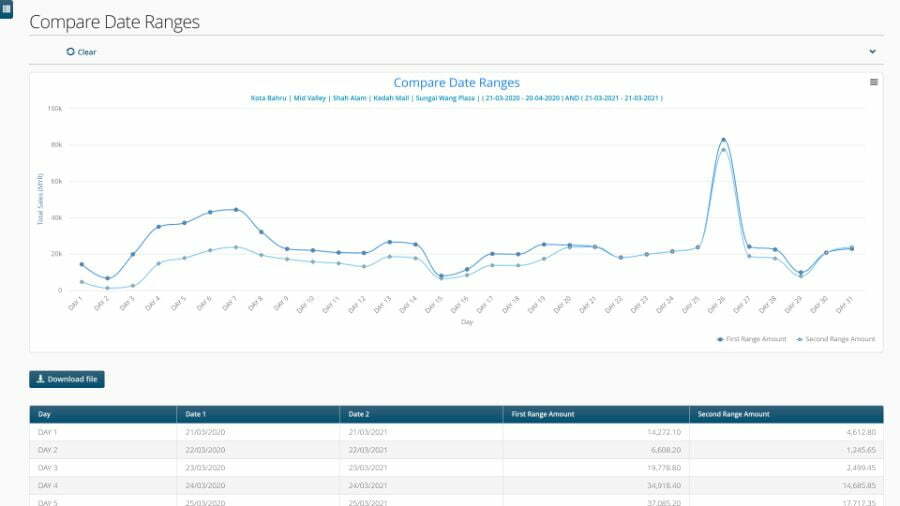
Compare Date Ranges
Compare date ranges allow you to select two date ranges or date comparisons to view specific performances of your business activities in a graph chart.
Use this feature to understand, monitor and assess insights into any promotions / campaigns / festivities / marketing related activities of your Outlet.
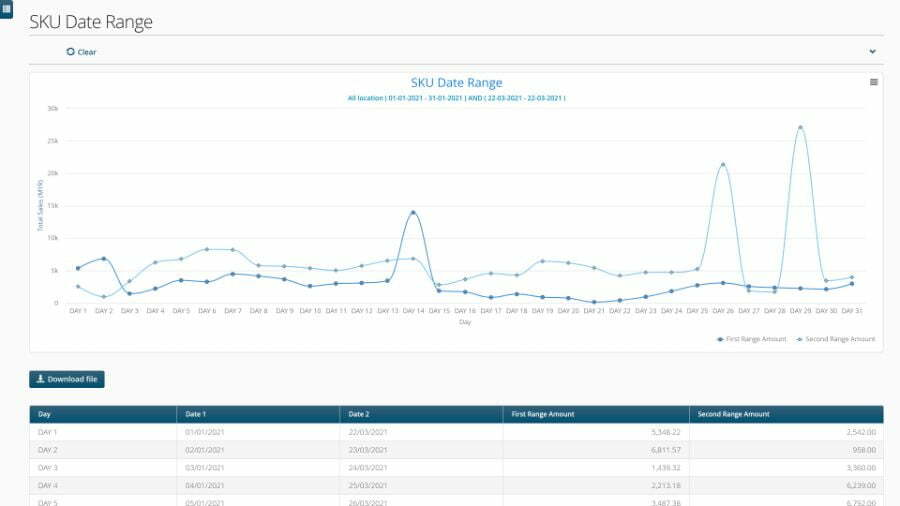
SKU Date Range
This report allows you to compare the sales of a particular SKU across two identical campaigns were performed over a distinct period.
This graphical line chart report also allows for a single or combination promotional views. Examine the efficacy of campaigning the SKU for more informed decision making on future campaigns / promotions / marketing approach.


SKU Report
This report provides the insights of top performing or non-performing SKUs according to its total amount transacted within a selected period.
This report allows you multiple views such as: -
1) By Occurrence
2) By Quantity
3) By Store
4) By Location
5) By Daily or hourly basis
Related Items Purchased
This report gives insights into the purchases made for various items in your stores. Pairing related items information helps you to plan your purchasing decisions or plan store promotions effectively.
More than that, know your customers choices better and increase sales for your stores.
This report has several views you can use to get Related Items Purchased where you can view by:
1) By date range
2) By Location Type (city, outlet, state)
3) By Location
4) By item search keyword(s)
5) By Advanced search


Start using your POS data to create AI-Generated BI reports
Receive in-depth business insights anytime and anywhere with SYCARDA's data analysis and business intelligence platform. Try out your free demo today!


