Revenue & Profitability
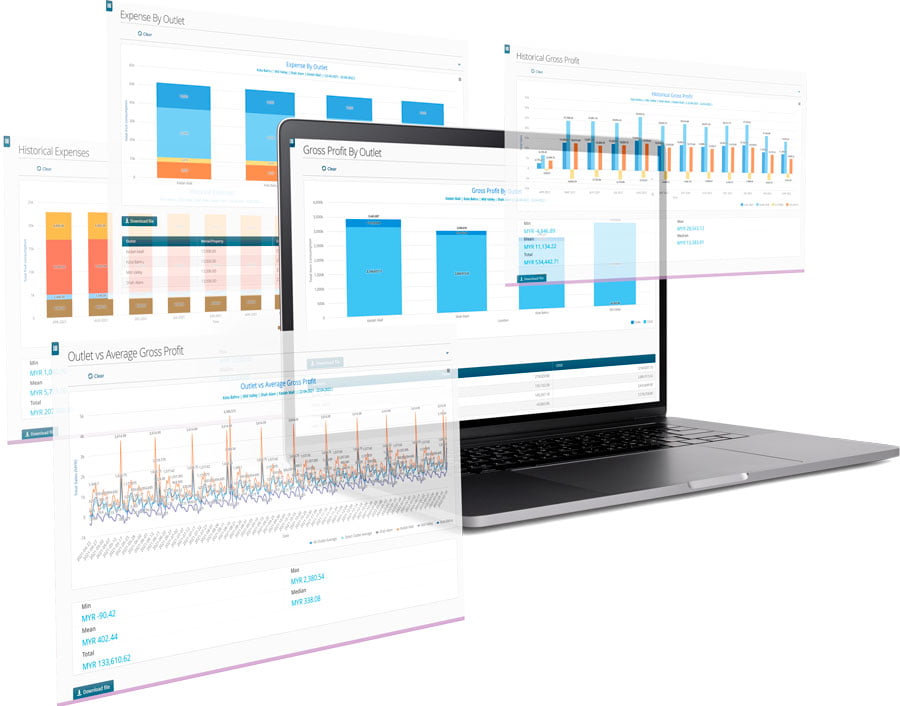
SYCARDA's real-time revenue monitoring can be supplemented by the Revenue Insights module that will track your expenses and business costs to provide business owners and managers with profitability tracking
![revenue-and-profitability 2 revenue and profitability](https://www.sycarda.ai/wp-content/uploads/2022/07/revenue-and-profitability.jpg)
How will you benefit from SYCARDA's Revenue & Profitability module?
![](https://www.sycarda.ai/wp-content/uploads/2022/05/management.png)
Business Management
![](https://www.sycarda.ai/wp-content/uploads/2022/05/revenue.png)
Revenue Management
![](https://www.sycarda.ai/wp-content/uploads/2022/05/finance.png)
Finance Management
![](https://www.sycarda.ai/wp-content/uploads/2022/05/marketing.png)
Sales & Marketing
Related key reports
![9.1.1 Revenue Insights - Gross Profit by Outlet 3 9.1.1 Revenue Insights Gross Profit by Outlet](https://www.sycarda.ai/wp-content/uploads/2022/04/9.1.1-Revenue-Insights-Gross-Profit-by-Outlet.jpg)
Gross Profit by Outlet
This report shows an Outlet profitability by reviewing Gross Profits and Cost of Goods Sold. Gross profit by Outlet is determined by subtracting the cost of goods sold (COGS) from Revenue (Sales).
Use this to know your best performing outlets or to improve outlet performance.
Historical Gross Profit
This report shows historical profitability trends, which are powerful insights to enable you to reach higher gross profit margin, with effective pricing strategies for your business.
![9.1.2 Revenue Insights - Historical Gross Profit 4 9.1.2 Revenue Insights Historical Gross Profit](https://www.sycarda.ai/wp-content/uploads/2022/04/9.1.2-Revenue-Insights-Historical-Gross-Profit.jpg)
![9.1.4 Revenue Insights - Expenses by Outlet 5 9.1.4 Revenue Insights Expenses by Outlet](https://www.sycarda.ai/wp-content/uploads/2022/04/9.1.4-Revenue-Insights-Expenses-by-Outlet.jpg)
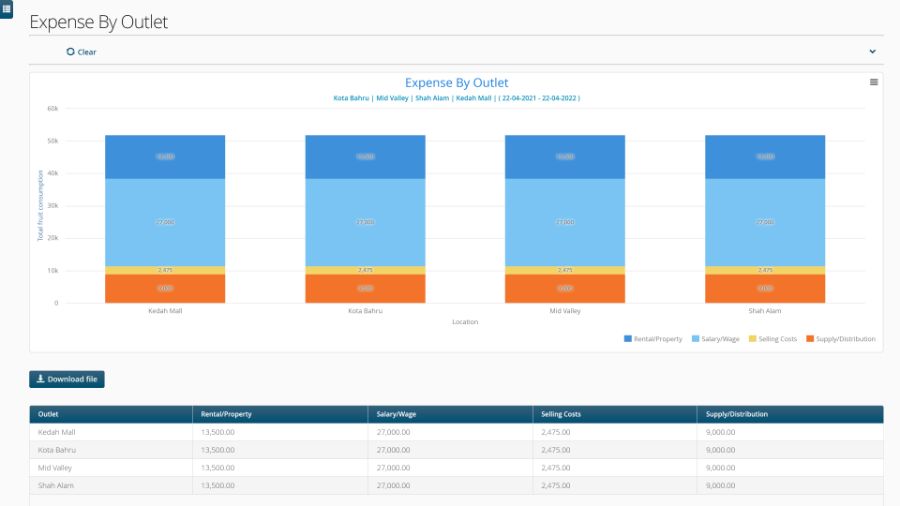
Expense by Outlet
Use this report to view the total number of sales versus the total number of sales targets, based on either the outlet or different time frames.
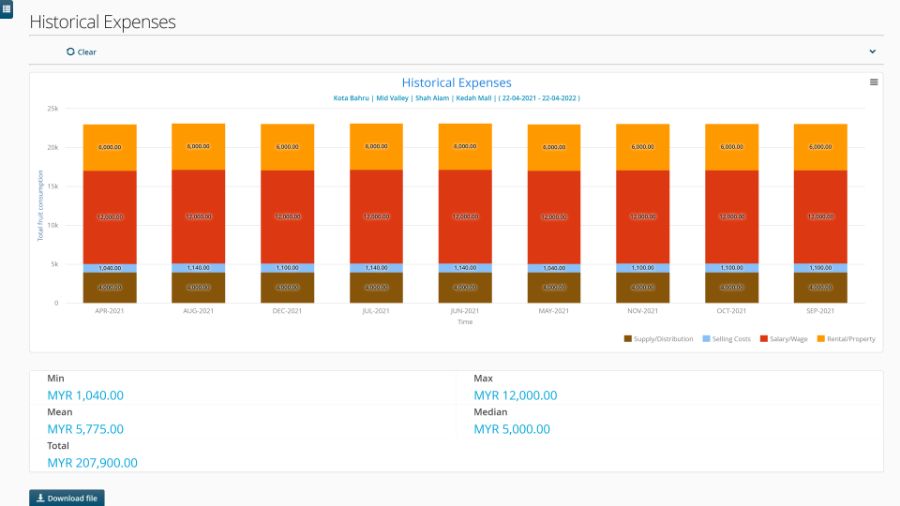
Historical Expenses
This report provides historical trends on the Outlet's expenses.
Use the information for quick understanding of fixed and variable expenses based on historical trends to forecast ways to effectively lower costs and increase profits.
![9.1.5 Revenue Insights - Historical Expenses 6 9.1.5 Revenue Insights Historical](https://www.sycarda.ai/wp-content/uploads/2022/04/9.1.5-Revenue-Insights-Historical-Expenses.jpg)
![9.1.6 Revenue Insights - Outlet vs Average Expenses 7 9.1.6 Revenue Insights Outlet vs Average](https://www.sycarda.ai/wp-content/uploads/2022/04/9.1.6-Revenue-Insights-Outlet-vs-Average-Expenses.jpg)
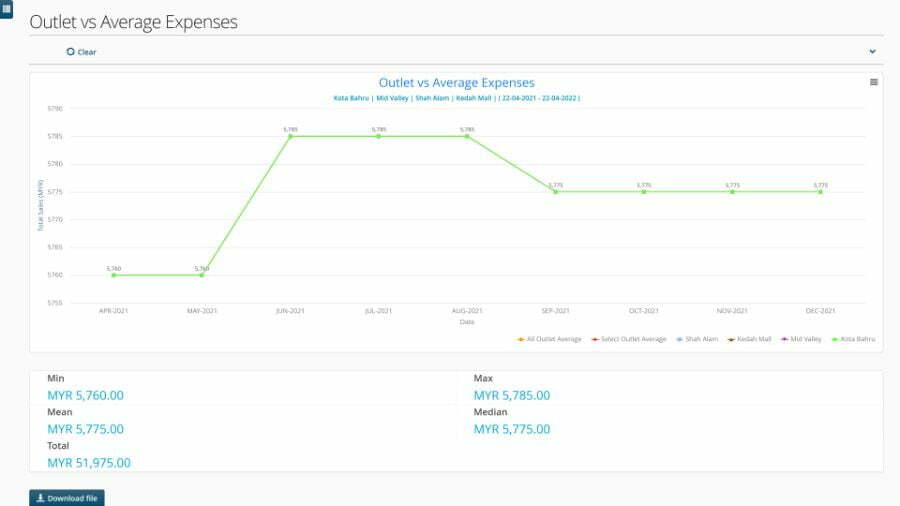
Outlet vs Average Expenses
This report provides information on the Outlet's expenses versus other outlet's average Expenses.
Use the insights to plan and identify essential ways and Outlets to effectively lower costs, for overall growth in your business profits.
Historical EBITDA
This Historical EBITDA report shows the Outlet's historical calculated earnings (but excludes any centralised overheads or costs, and any provisions or payments in respect of taxation) of the Outlet. This will show the historical percentage (%) contribution trends of Outlet's EBITDA to your Business as a whole.
![9.1.8 Revenue Insights - Historical EBITDA 8 9.1.8 Revenue Insights Historical EBITDA](https://www.sycarda.ai/wp-content/uploads/2022/04/9.1.8-Revenue-Insights-Historical-EBITDA.jpg)
![9.1.9 Revenue Insights - Outlet vs Average EBITDA 9 9.1.9 Revenue Insights Outlet vs Average EBITDA](https://www.sycarda.ai/wp-content/uploads/2022/04/9.1.9-Revenue-Insights-Outlet-vs-Average-EBITDA.jpg)
Outlet vs Average EBITDA
This report shows the Outlet’s EBITDA versus the other outlets EBITDA. This insight allows you to make any critical changes to outlet strategies based on top contributing outlets, or outlets to improve their EBITDA contribution and standing in your business model.
Start using your POS data to create AI-Generated BI reports
Receive in-depth business insights anytime and anywhere with SYCARDA's data analysis and business intelligence platform. Try out your free demo today!
![test-3 10 test 3](https://www.sycarda.ai/wp-content/uploads/2022/04/test-3.jpg)